Treasury Yields Snapshot: October 17, 2025
News Summary
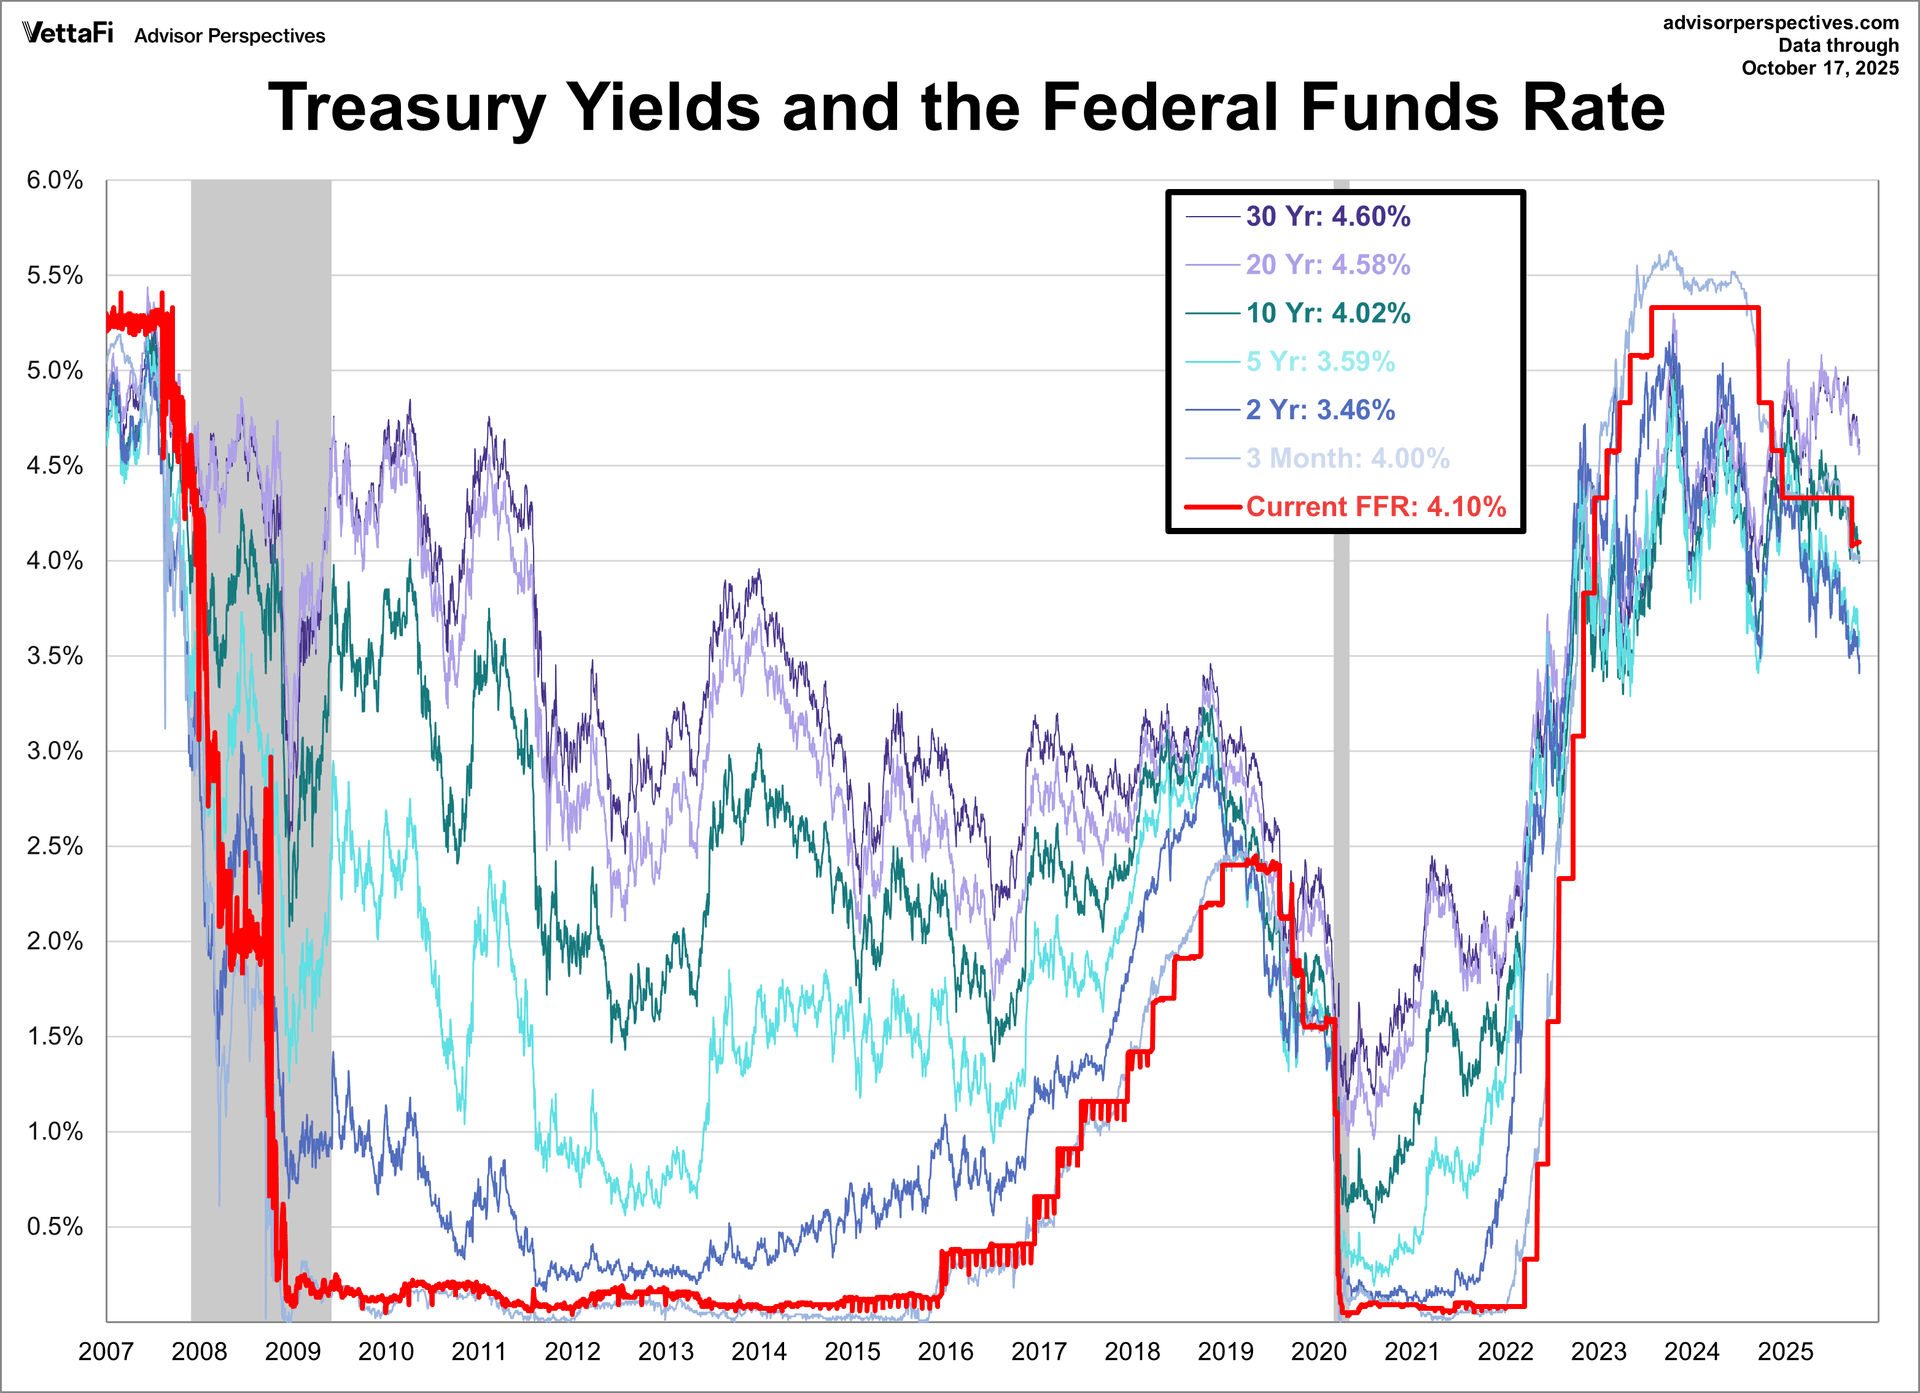
As of October 17, 2025, the U.S. 10-year Treasury note yield dipped below 4.00% this week for the first time in over a year, closing at 4.02%. Concurrently, the 2-year note yield reached its lowest point since September 2022, settling at 3.46%. The article highlights the significance of inverted yield curves (10-2 and 10-3 month spreads) as reliable leading indicators for recessions. The 10-2 spread was continuously negative from July 2022 to August 2024, with the last negative instance in early September 2024, implying a potential recession lead time of 18.5 to 48 weeks based on historical averages. Similarly, the 10-3 month spread was negative from October 2022 to December 2024 and has fluctuated recently. Historical data suggests a recession lead time of 13 to 48 weeks from this spread. Despite the Federal Reserve's rate-cutting cycle beginning in September, mortgage rates initially moved counter to expectations. However, they have recently been declining while the Fed maintains steady rates, with the 30-year fixed rate currently at 6.27%.
Background
U.S. Treasury yields are a critical benchmark for global financial markets, with their movements reflecting market expectations for future economic growth, inflation, and monetary policy. An inverted yield curve, where short-term Treasury yields exceed long-term yields, is widely considered a reliable leading indicator of economic recession due to its historical accuracy preceding multiple downturns. The Federal Reserve's (Fed) Federal Funds Rate (FFR) serves as the benchmark for interbank short-term lending and directly influences consumer borrowing costs, including mortgage rates. In 2025, the Fed, under the Trump administration, initiated a rate-cutting cycle in September, aiming to stimulate economic growth. However, market responses to these cuts and the overall economic outlook remain complex, particularly amid potentially persistent inflationary pressures.
In-Depth AI Insights
What do the prolonged duration and unique characteristics of the current inverted yield curve signify for recession forecasting? - The unusually extended period of the current yield curve inversion, particularly the 10-2 and 10-3 month spreads, starting mid-2022, significantly exceeds historical averages. This might suggest more profound structural challenges in the economy rather than mere cyclical fluctuations. - While historical data consistently links inversions to recessions, the wide variance in "lead times" (13 to 92 weeks) indicates that relying solely on curve inversion for precise timing of a recession is challenging. Investors should monitor other macroeconomic indicators such as employment data, consumer spending, and manufacturing activity for a more comprehensive view. - The persistent inversion even after the Fed's rate-cutting cycle began, with short-term yields remaining relatively elevated as long-term yields decline, could reflect ongoing market concerns about the future inflation path or skepticism regarding the Fed's ability to orchestrate a true "soft landing." What underlying market dynamics are revealed by the divergence between the Fed's rate-cutting cycle and mortgage rate movements? - The initial counter-intuitive rise in mortgage rates after the Fed's September rate cut likely reflected investor uncertainty about the pace and extent of Fed easing, or persistent inflation expectations that the market had not fully priced out. If the market believes cuts are insufficient to curb inflation, long-term bond yields (which influence mortgage rates) may not decline in tandem with short-term rates. - The recent decline in mortgage rates while the Fed holds rates steady could indicate strengthening market expectations of a future economic slowdown, leading to increased demand for long-term safe assets like Mortgage-Backed Securities (MBS) and thereby depressing their yields. - This divergence could also suggest that bank lending costs and risk premiums are not entirely tethered to the Federal Funds Rate. Banks' own assessments of economic outlook, credit risk, and capital adequacy may significantly influence the mortgage rates they set, creating a disconnect from central bank policy signals. How should investors adjust their fixed income strategies amidst falling yields and an uncertain economic outlook? - With long-term yields breaching key psychological barriers and short-term yields also at lower levels, fixed income investors may face a lower overall return environment. Historically, in such environments, investors may pivot towards yield-seeking strategies, such as higher-dividend stocks or high-yield bonds, albeit with increased risk. - Given the recessionary signal from the inverted yield curve, investors might consider increasing exposure to high-quality, shorter-duration Treasuries or short-term investment-grade corporate bonds to lock in relatively stable income and maintain liquidity, while mitigating long-term interest rate volatility. - As the Fed may continue cutting rates to address potential economic deceleration, investors should closely monitor inflation data and Fed communications. If inflationary pressures ease, longer-duration bonds could offer greater capital appreciation potential, but if inflation remains sticky, real yields could be further compressed, suggesting diversification into Treasury Inflation-Protected Securities (TIPS) to hedge against this risk.